
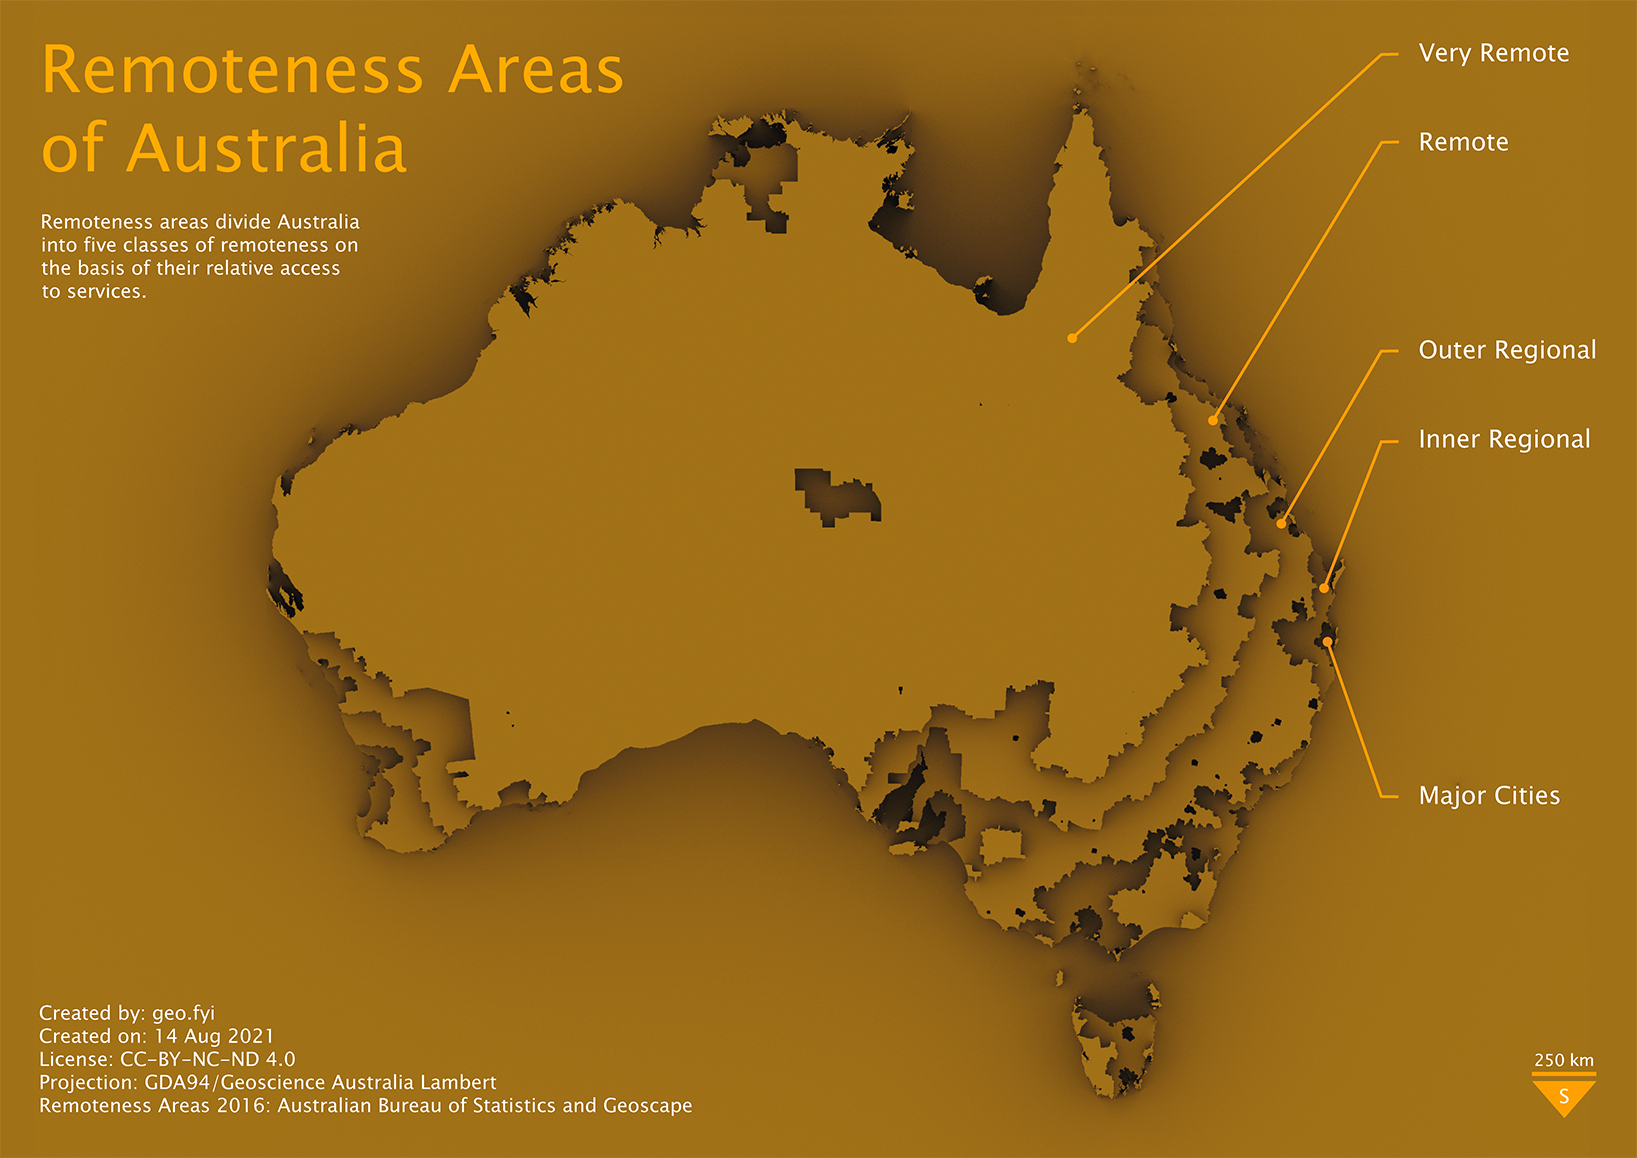
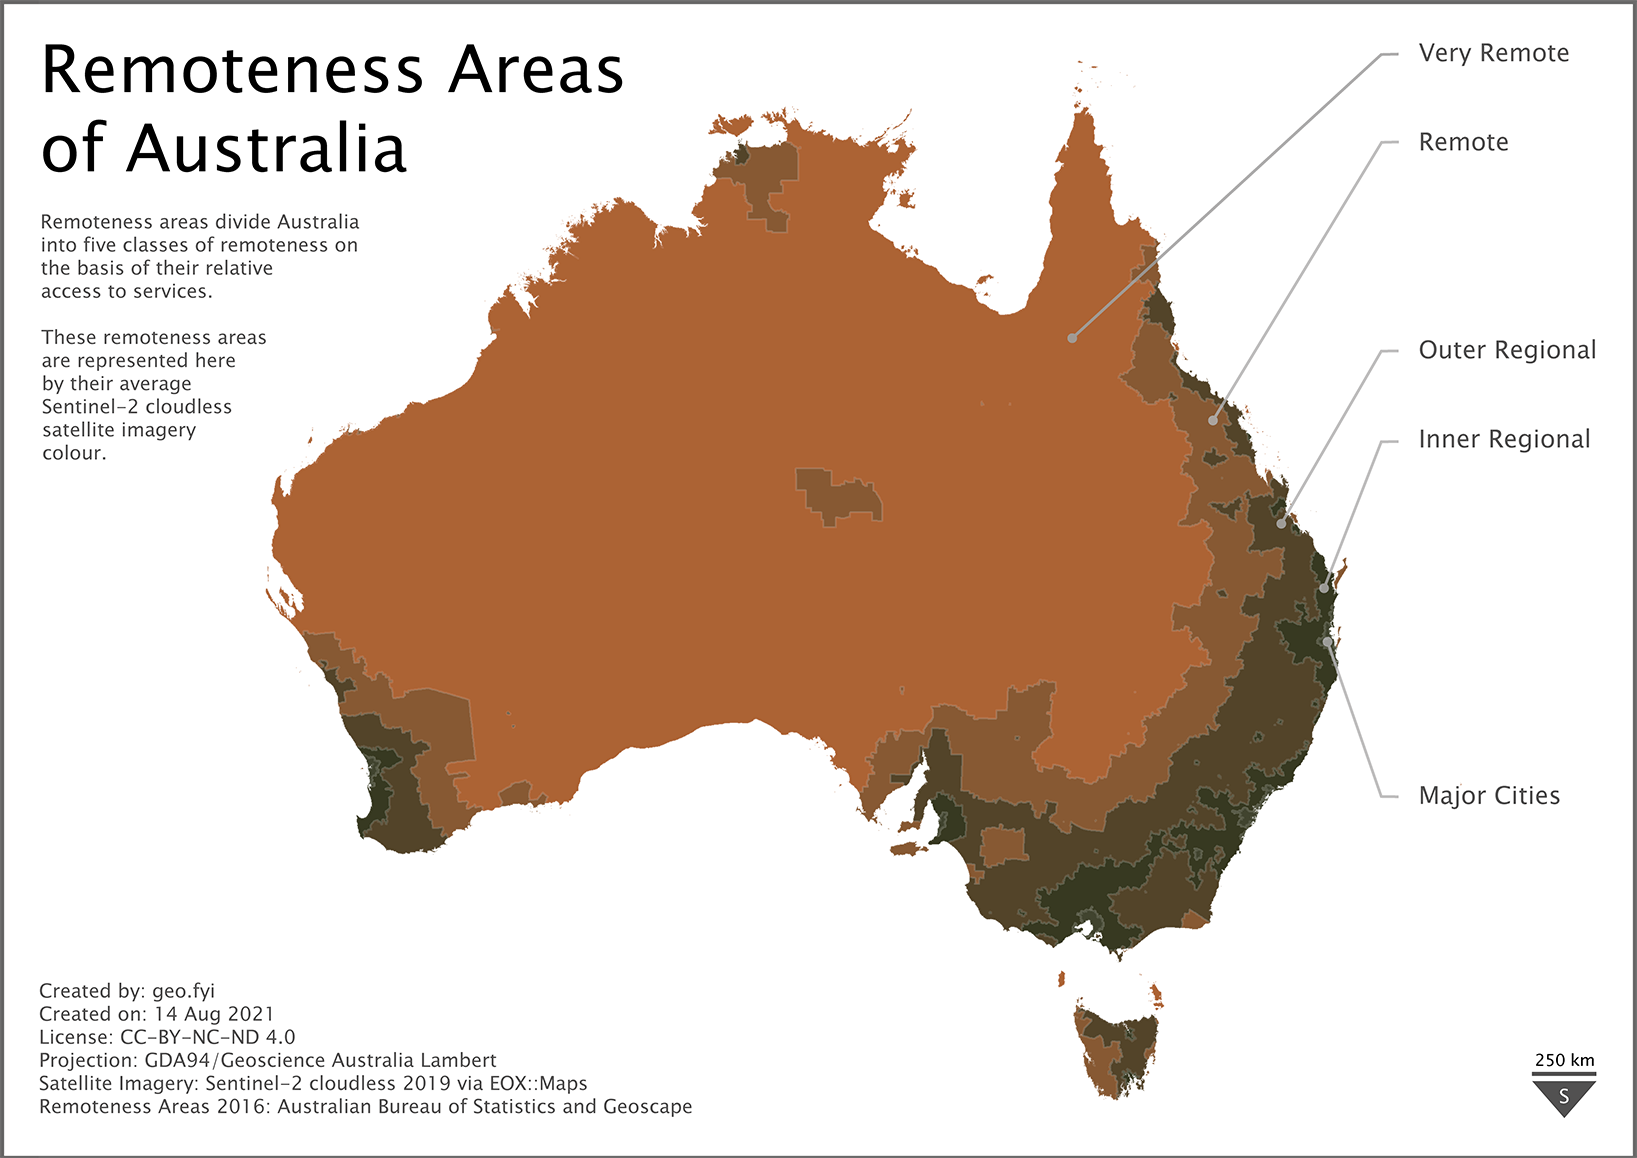
Remoteness Areas divide Australia into five classes of remoteness on the basis of a measure of relative access to services.
Access to services are measured using the Accessibility and Remoteness Index of Australia (ARIA+) based on the Census of Population and Housing and produced by the Hugo Centre for Population and Housing.
An ARIA+ 2016 Demonstration Map is available and the names, scoring range and description for each remoteness area is shown below.
| Remoteness Area | ARIA+ Score | Accessibility to a wide range of goods, services and opportunities for social interaction |
|---|---|---|
| Major Cities | 0 <= 0.20 | Relatively unrestricted |
| Inner Regional | >0.20 to <=2.40 | Some restrictions |
| Outer Regional | >2.40 to <=5.92 | Significantly restricted |
| Remote | >5.92 to <=10.53 | Very restricted |
| Very Remote | >10.53 | Very little accessibility |
The geography of remoteness areas is managed by the Australian Bureau of Statistics (ABS) as part of the Australian Statistical Geography Standard (ASGS).
Depicting Remoteness Areas
Using data from Geoscape, the maps below take two different approaches to depicting the remoteness areas of Australia.
The first map uses Aerialod to extrude the remoteness areas in to increasing heights.
The second map depicts remoteness areas using their average colour as derived from Sentinal-2 cloudless 2019 imagery provided by EOX::Maps using a R/GDAL process from Data Stuff.
See also Scotland’s Less Accessible Locations for a different approach to mapping remoteness/accessibility.
