
Land Surface Temperature (LST) is:
“how hot the surface of the Earth would feel to the touch in a particular location”
A common source of LST data is Landsat 8 and its 30m x 30m resolution Band 10 Thermal Infrared Scanner (TIRS) imagery.
Using this imagery for the settlement of Edinburgh from 06 June 2013 to 27 January 2022, the maps below were produced to visualise the estimated:
– LST outliers – ‘cold’ and ‘hot’ spot candidates.
– LST of the ‘built environment’.
The production methodology is provided at the end of the post.
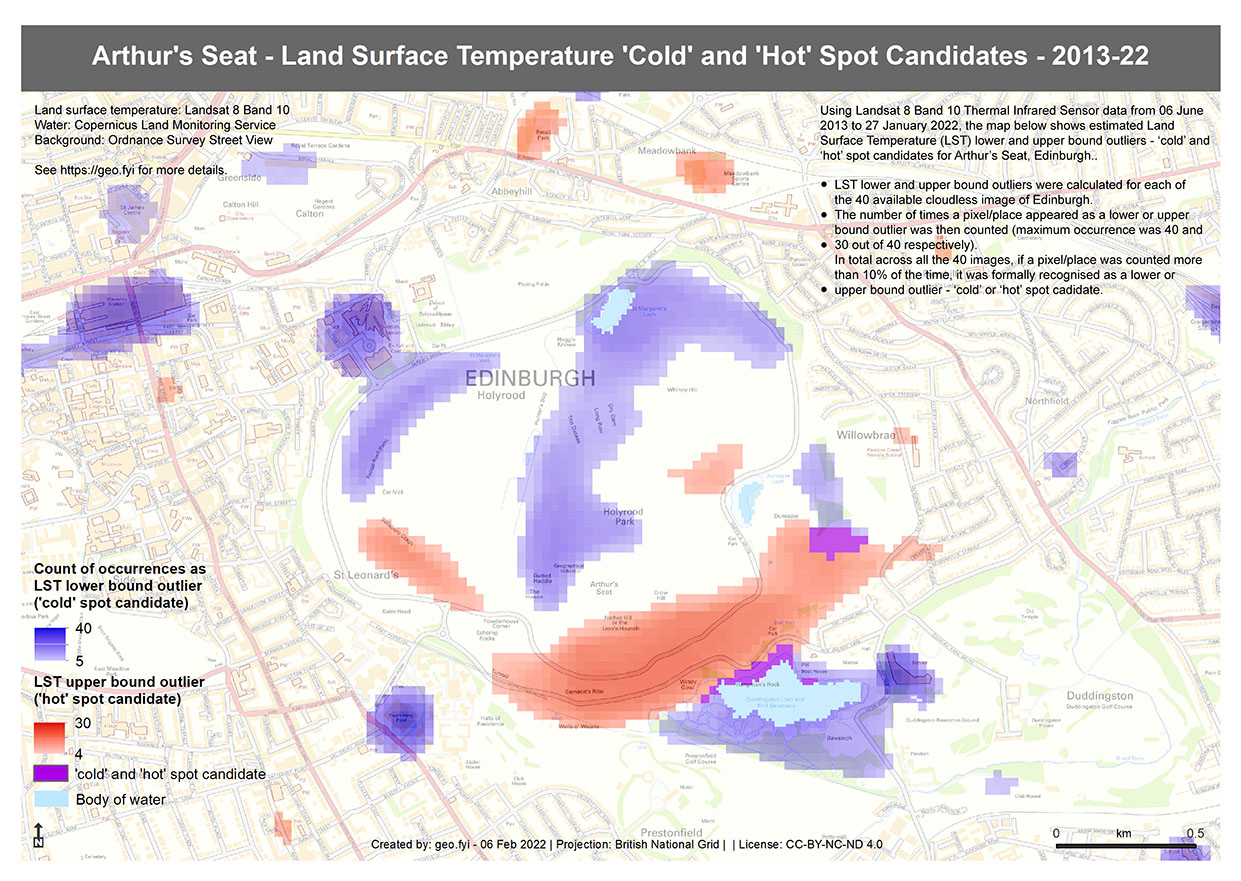
LST outliers
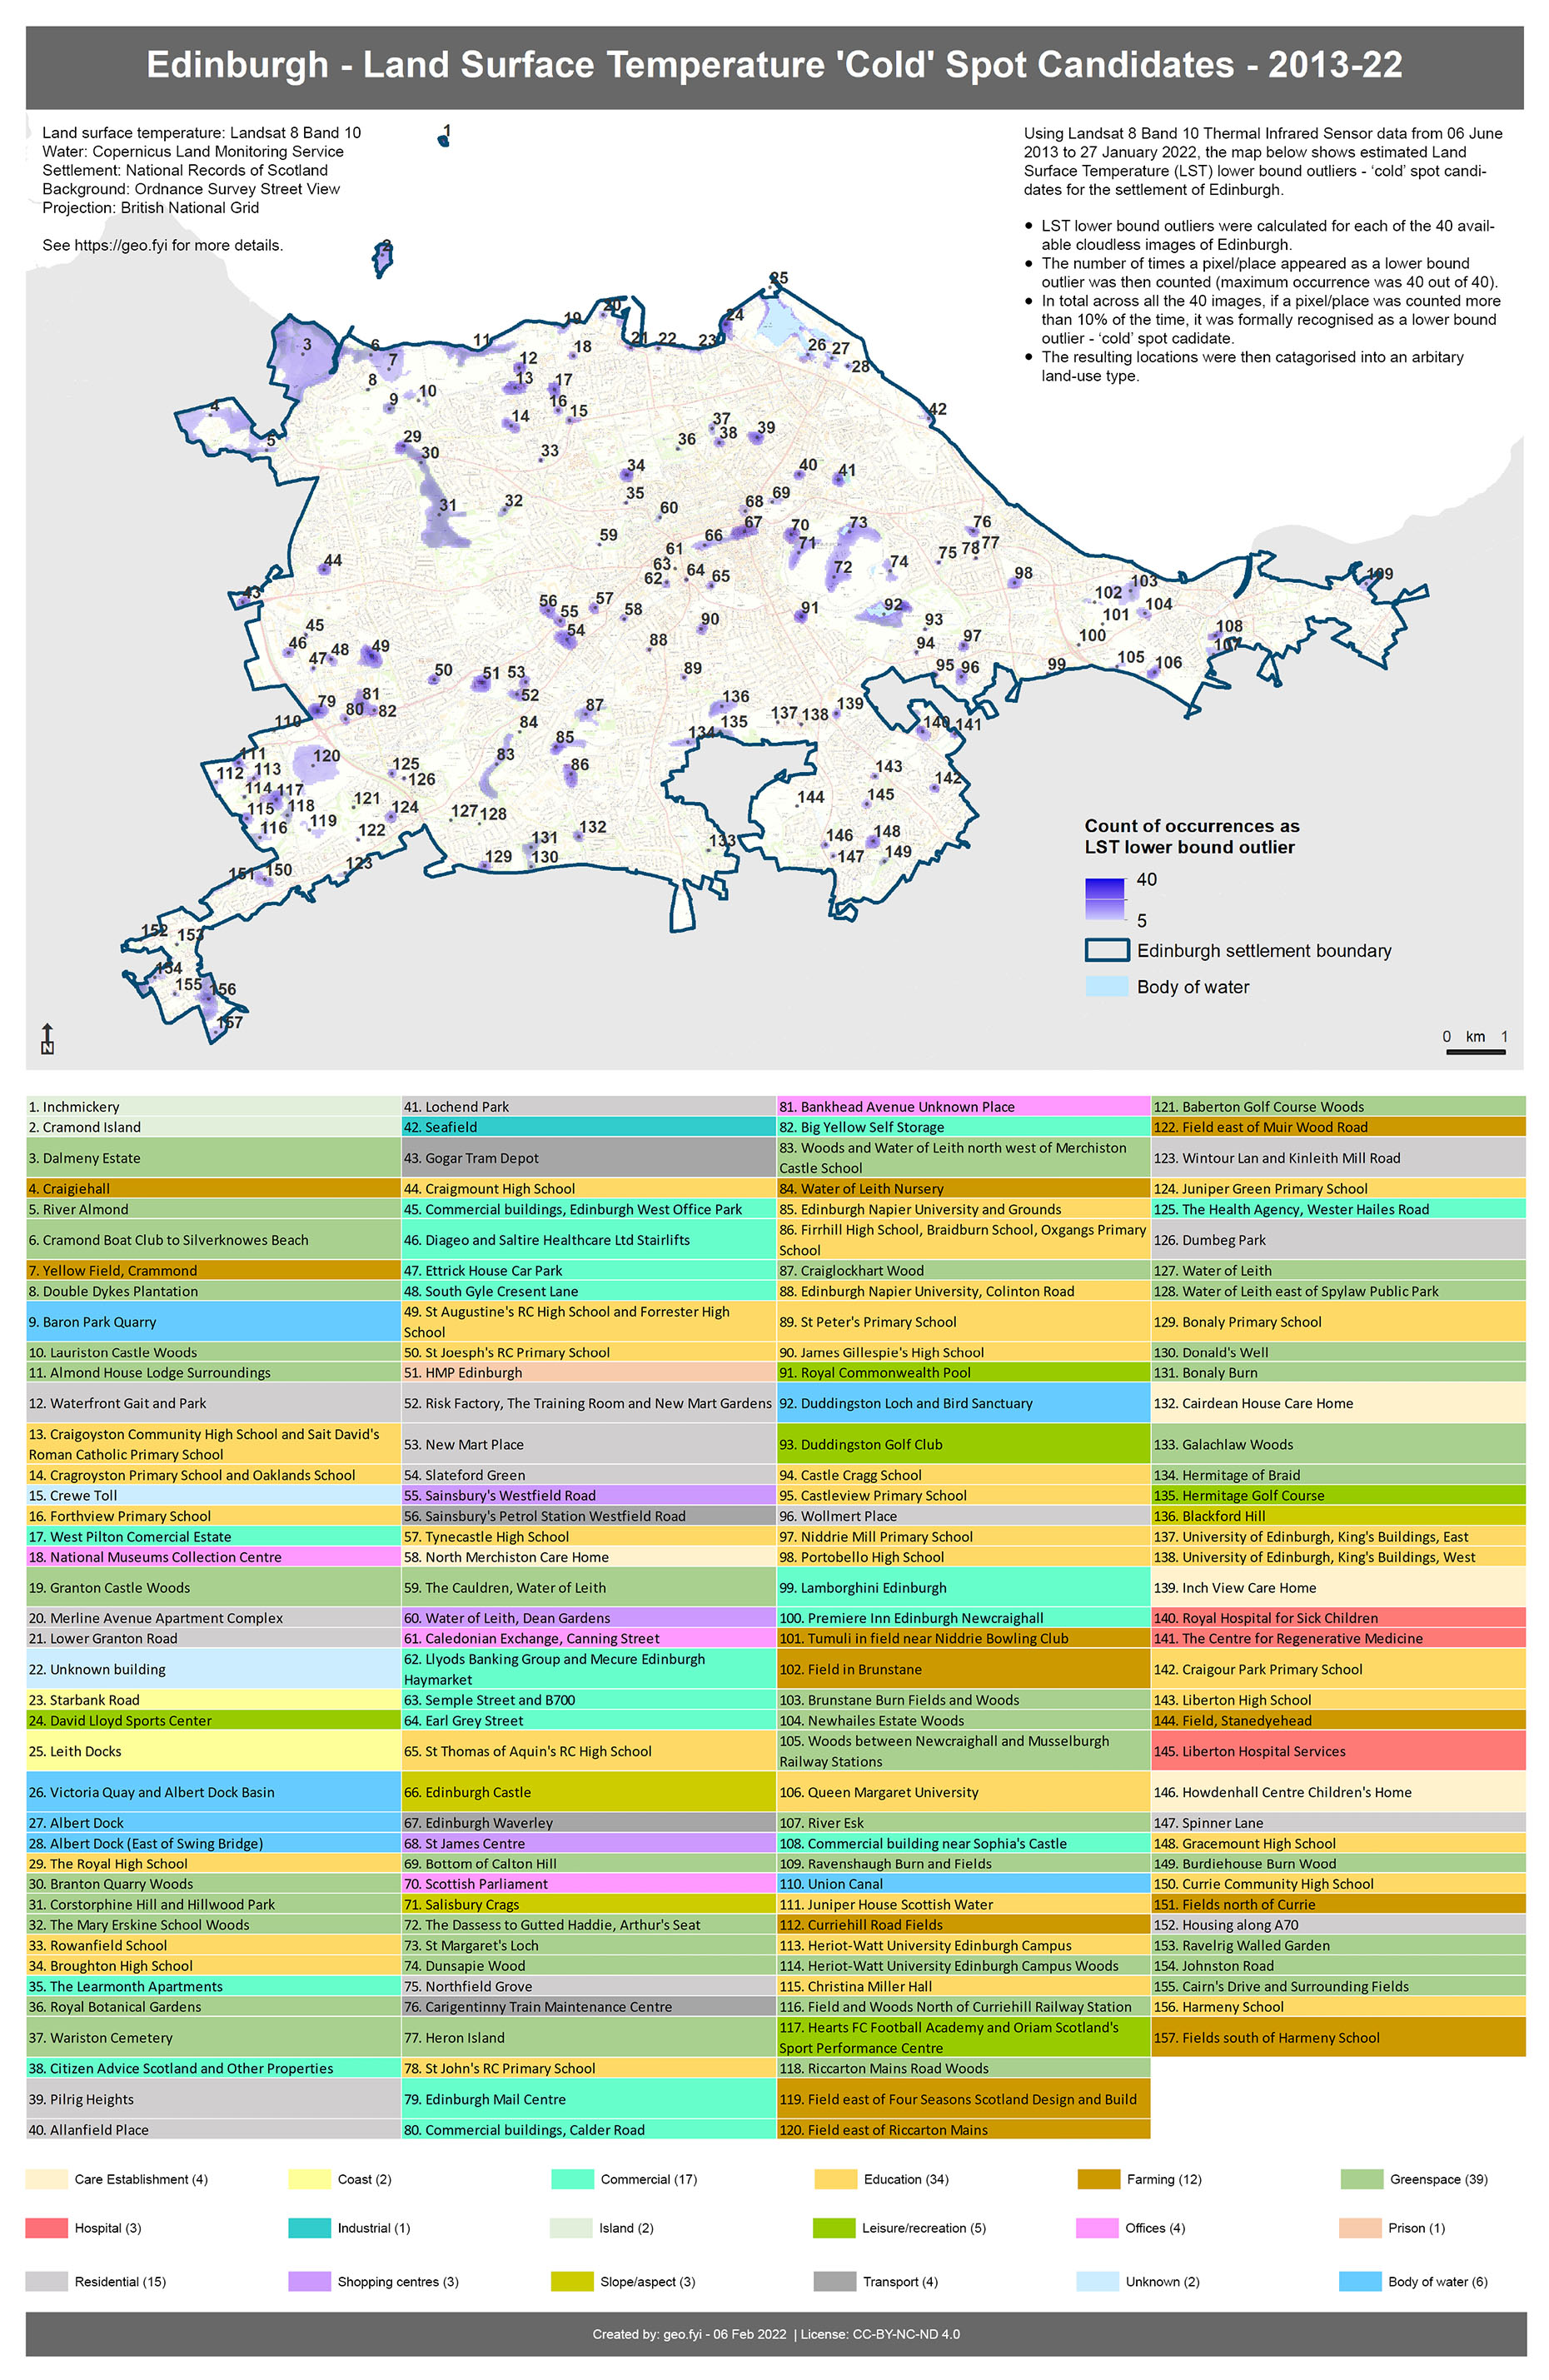
LST lower bound outliers – ‘cold’ spot candidates
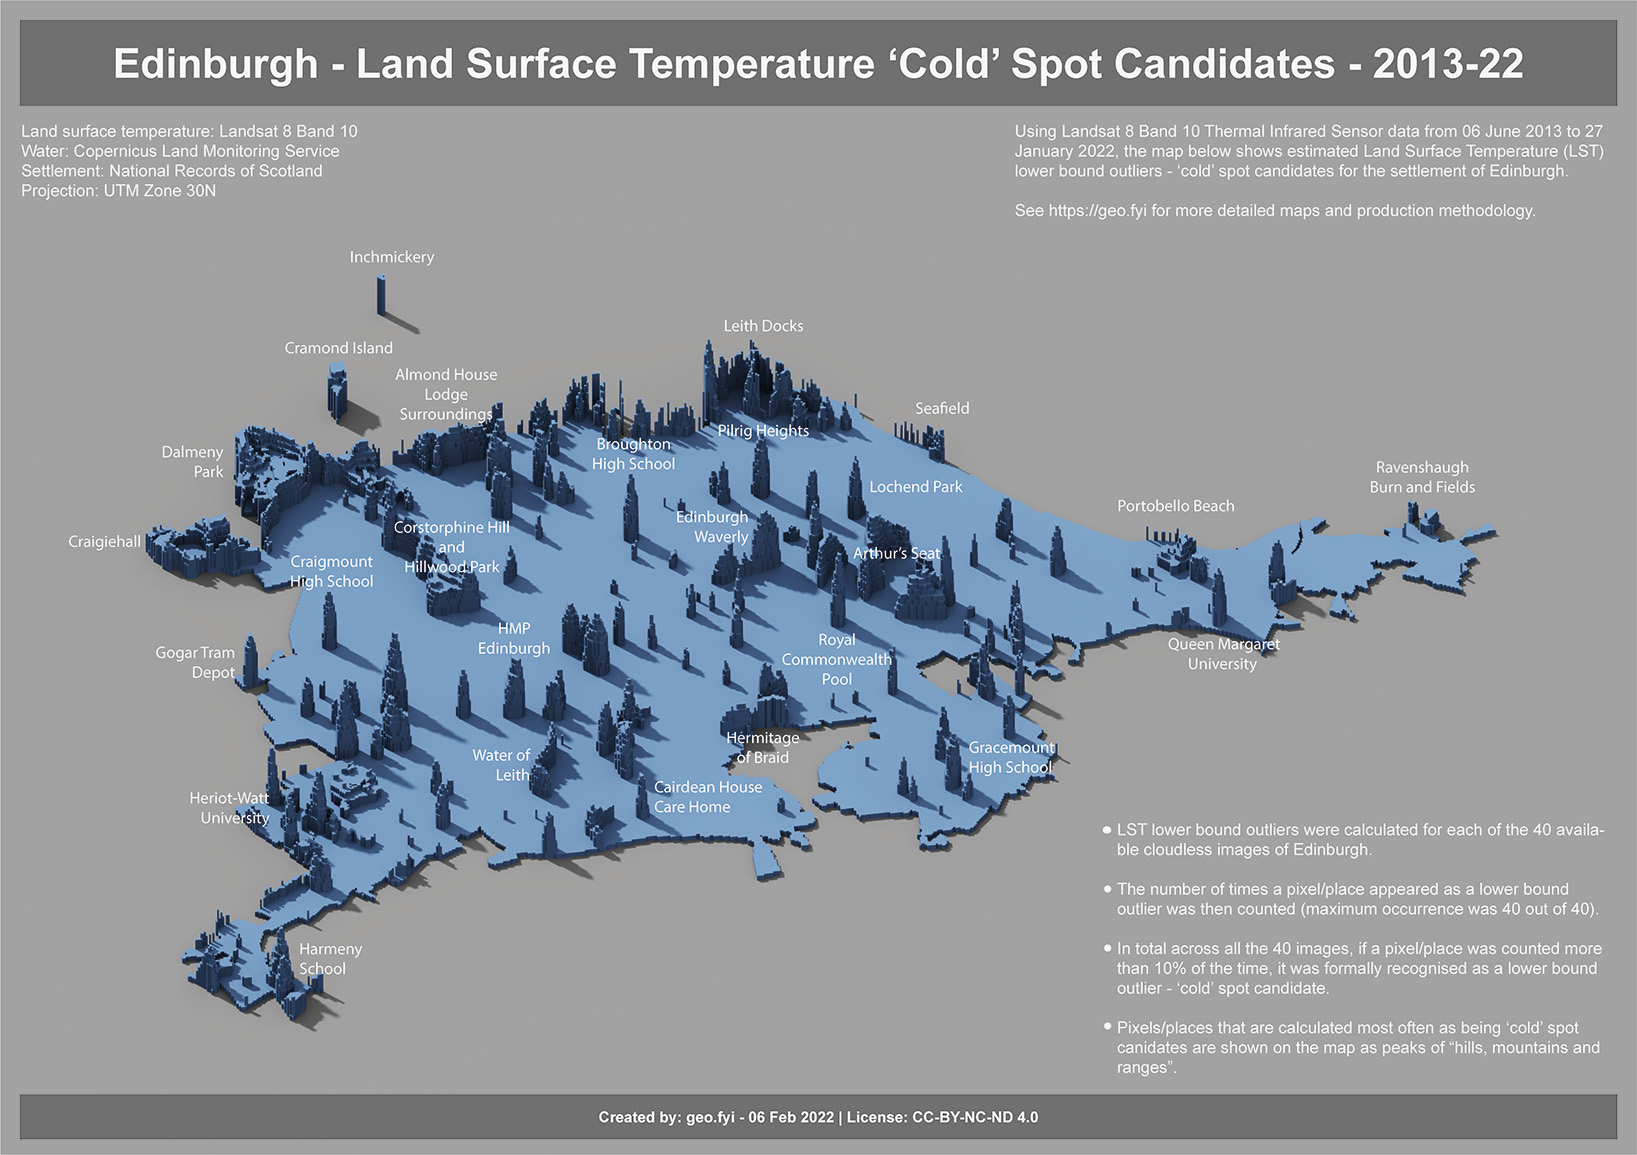
The data is perhaps better visualised in 3d, showing pixels/places that are calculated most often as being ‘cold’ spot candidates as peaks of “hills, mountains and ranges”.
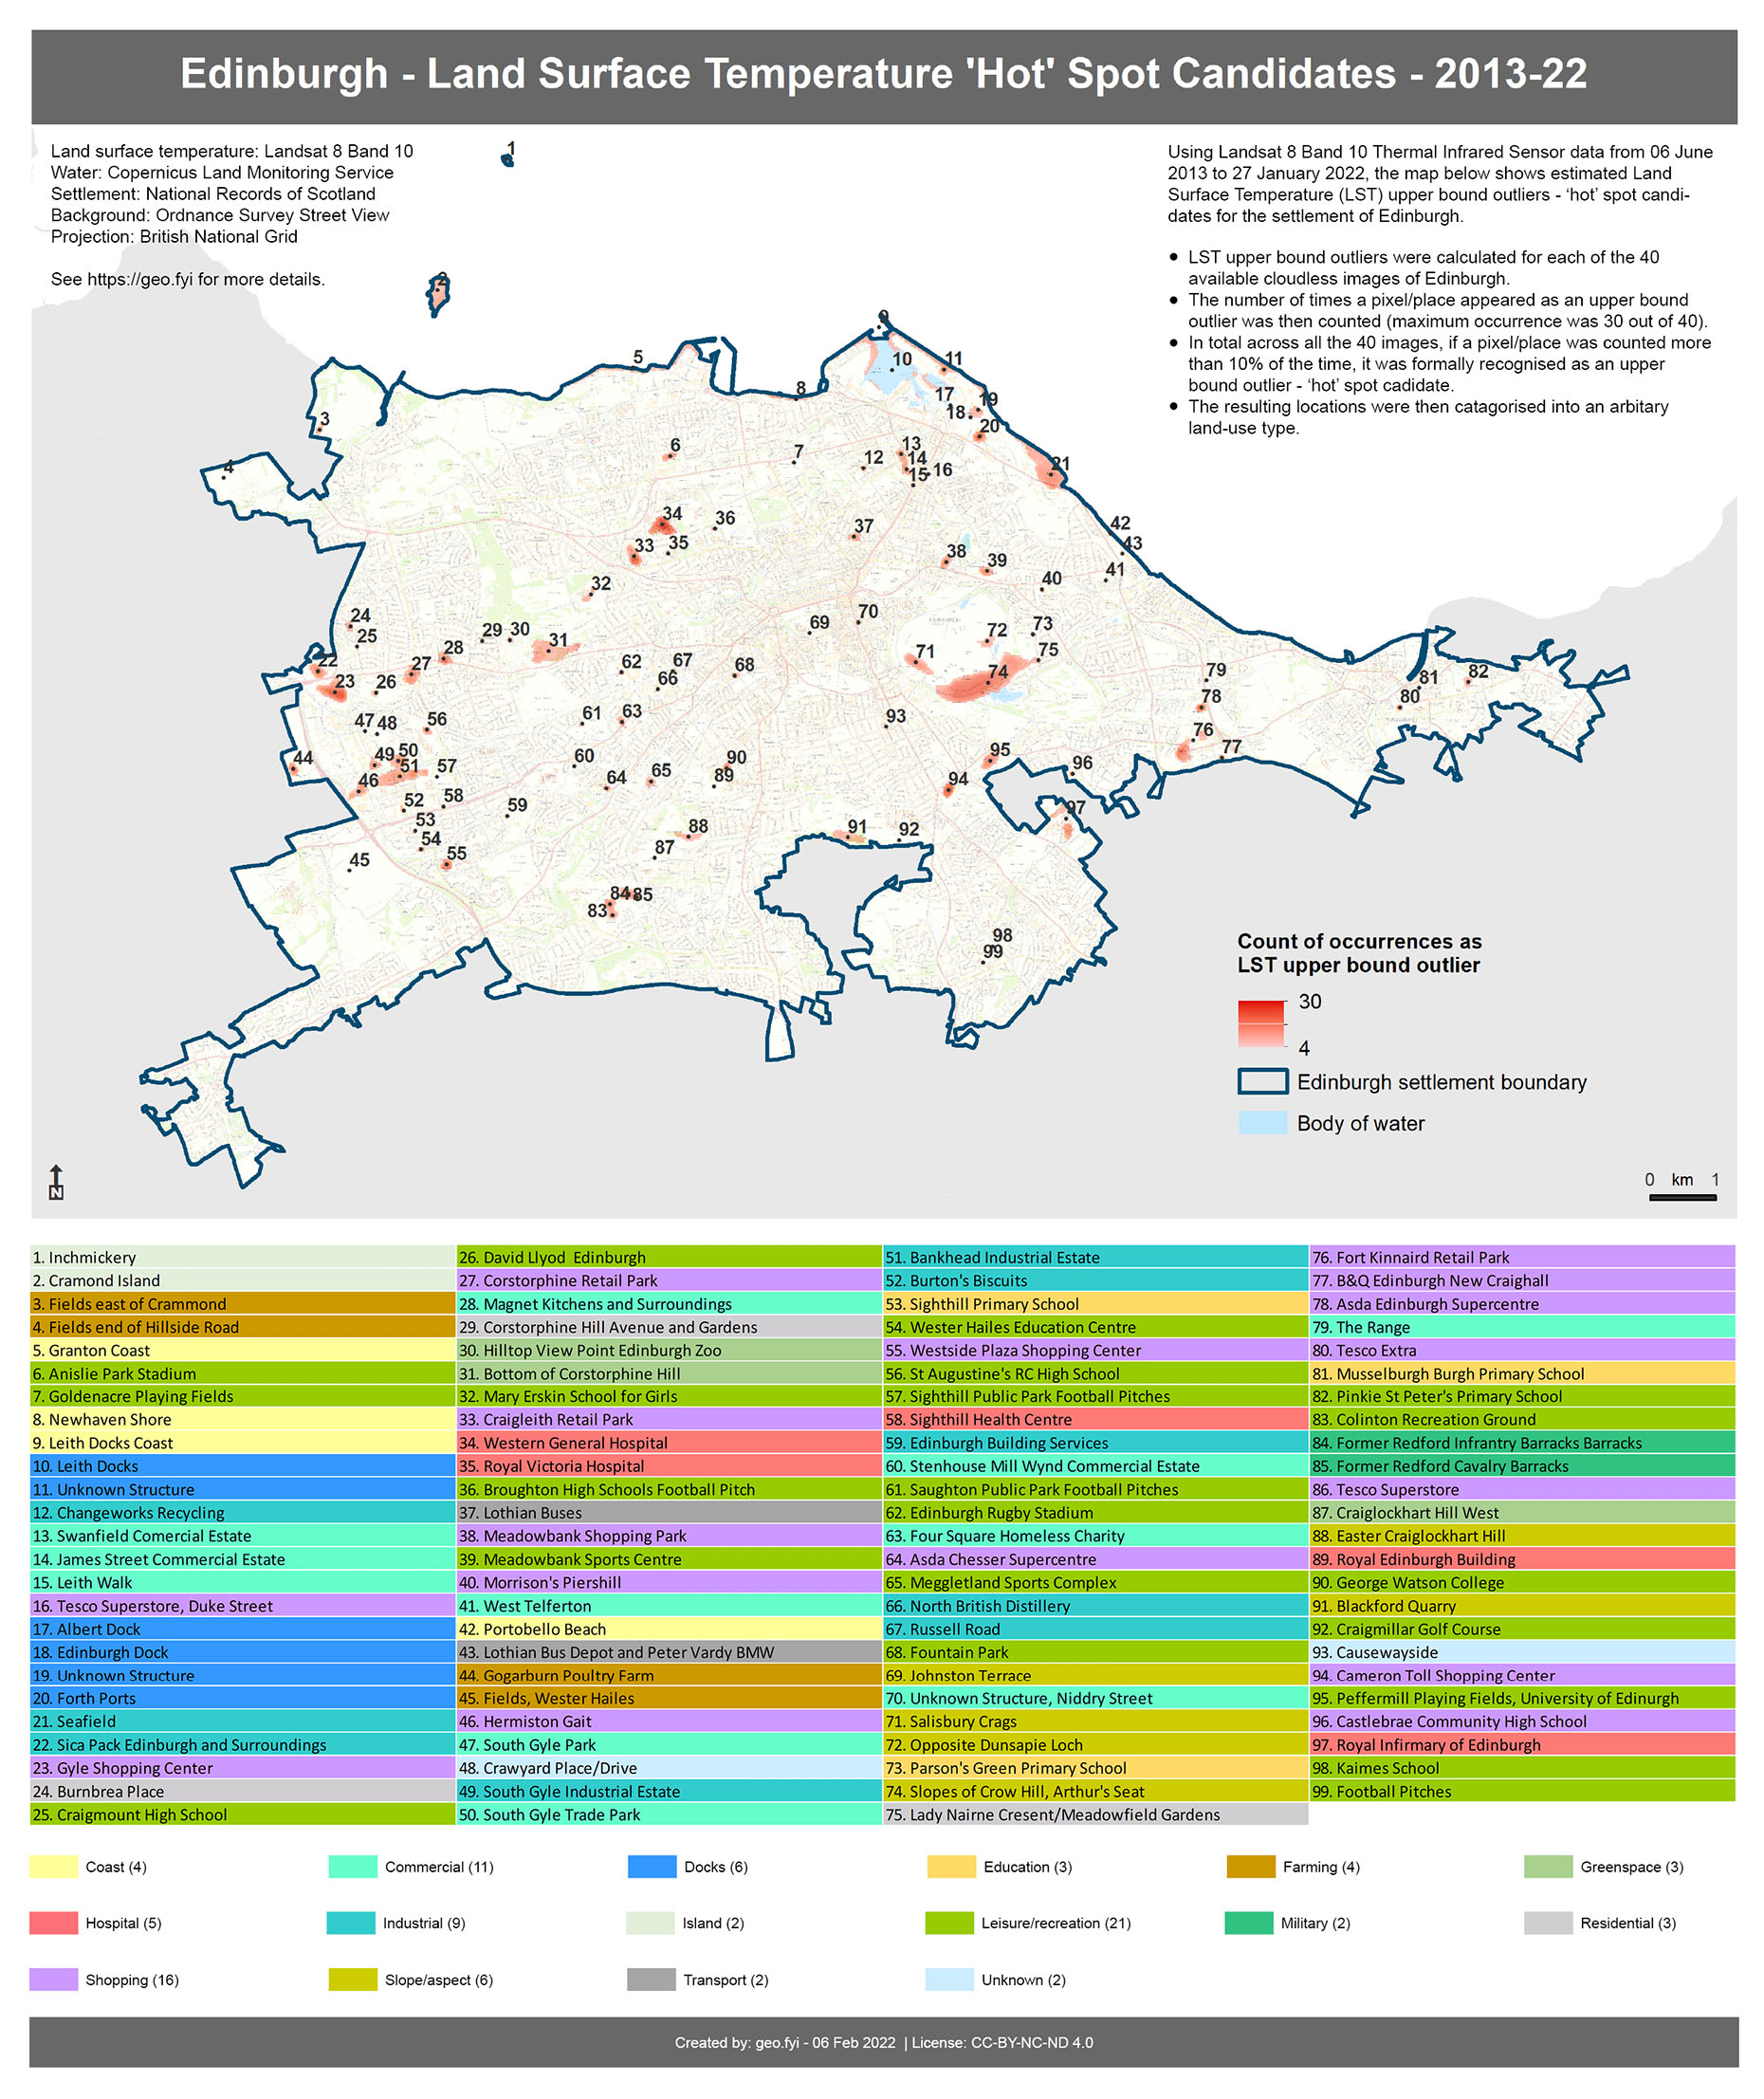
LST upper bound outliers – ‘hot’ spot candidates
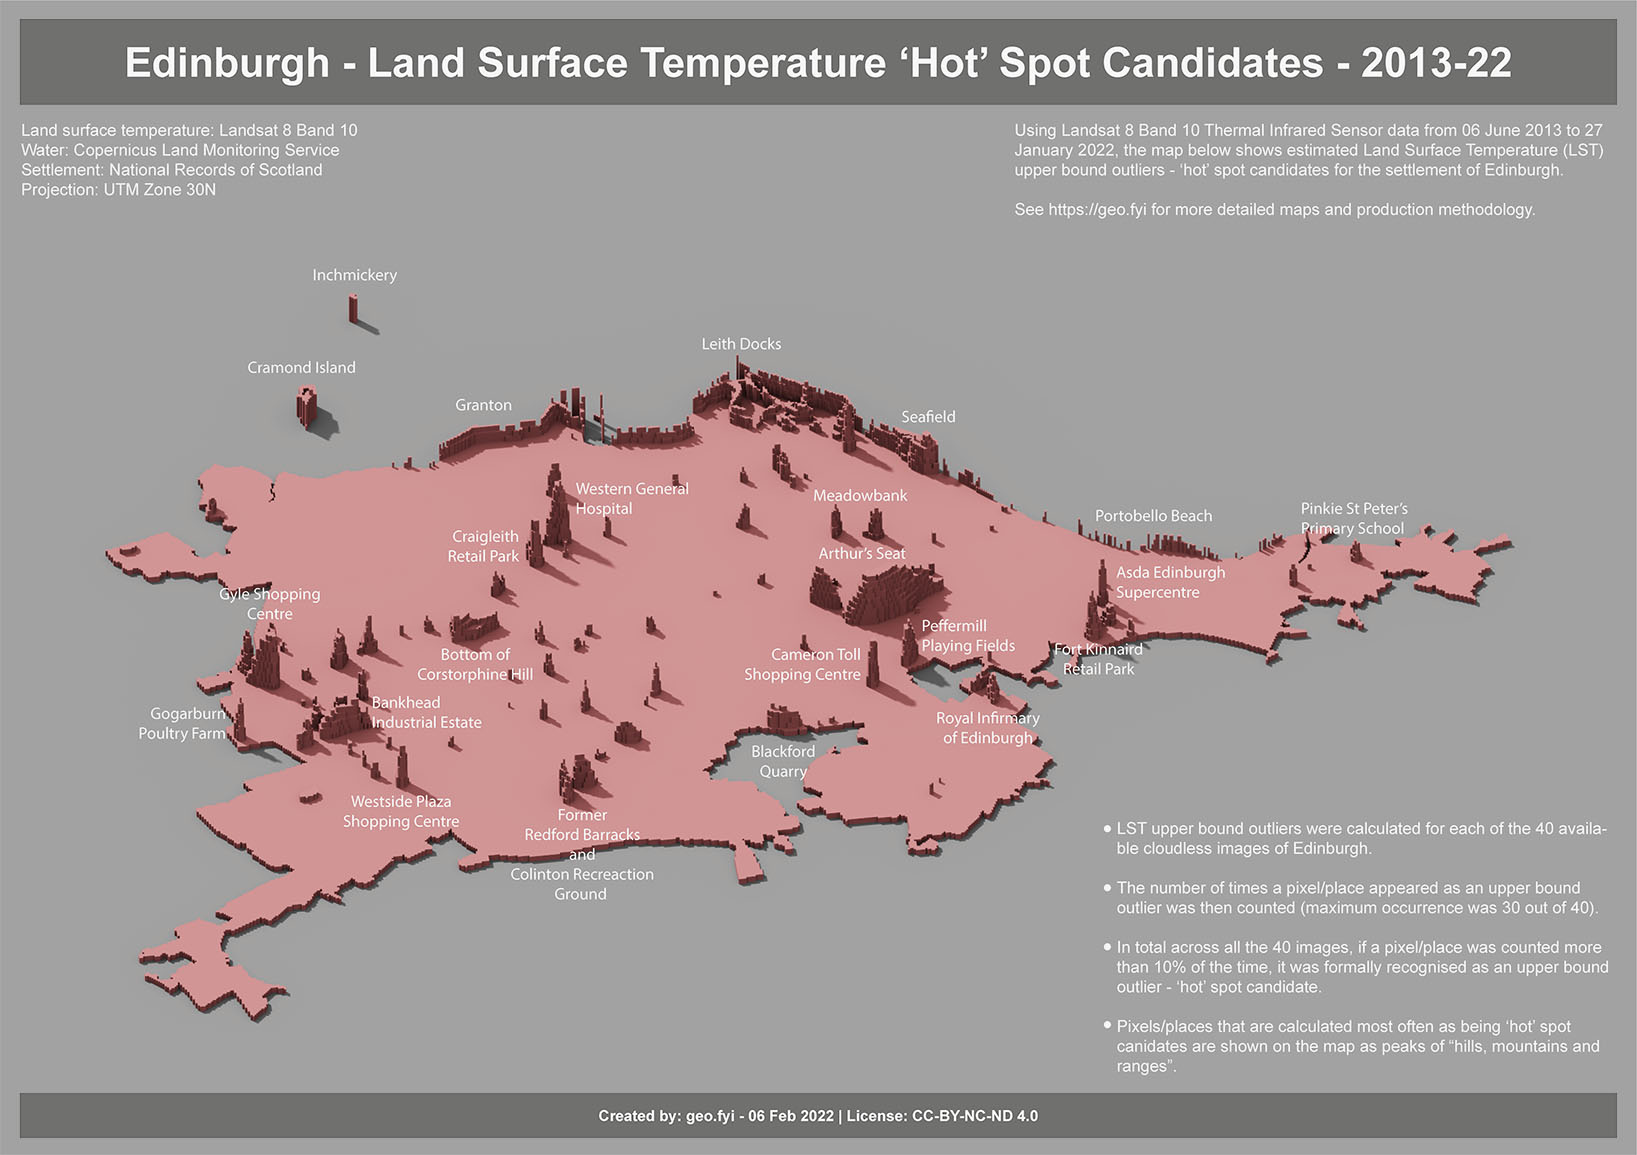
The data is perhaps better visualised in 3d, showing pixels/places that are calculated most often as being ‘hot’ spot candidates as peaks of “hills, mountains and ranges”.
Arthur’s Seat
The processing shows Arthur’s Seat with different areas as ‘cold’ and/or ‘hot’ spot candidates.
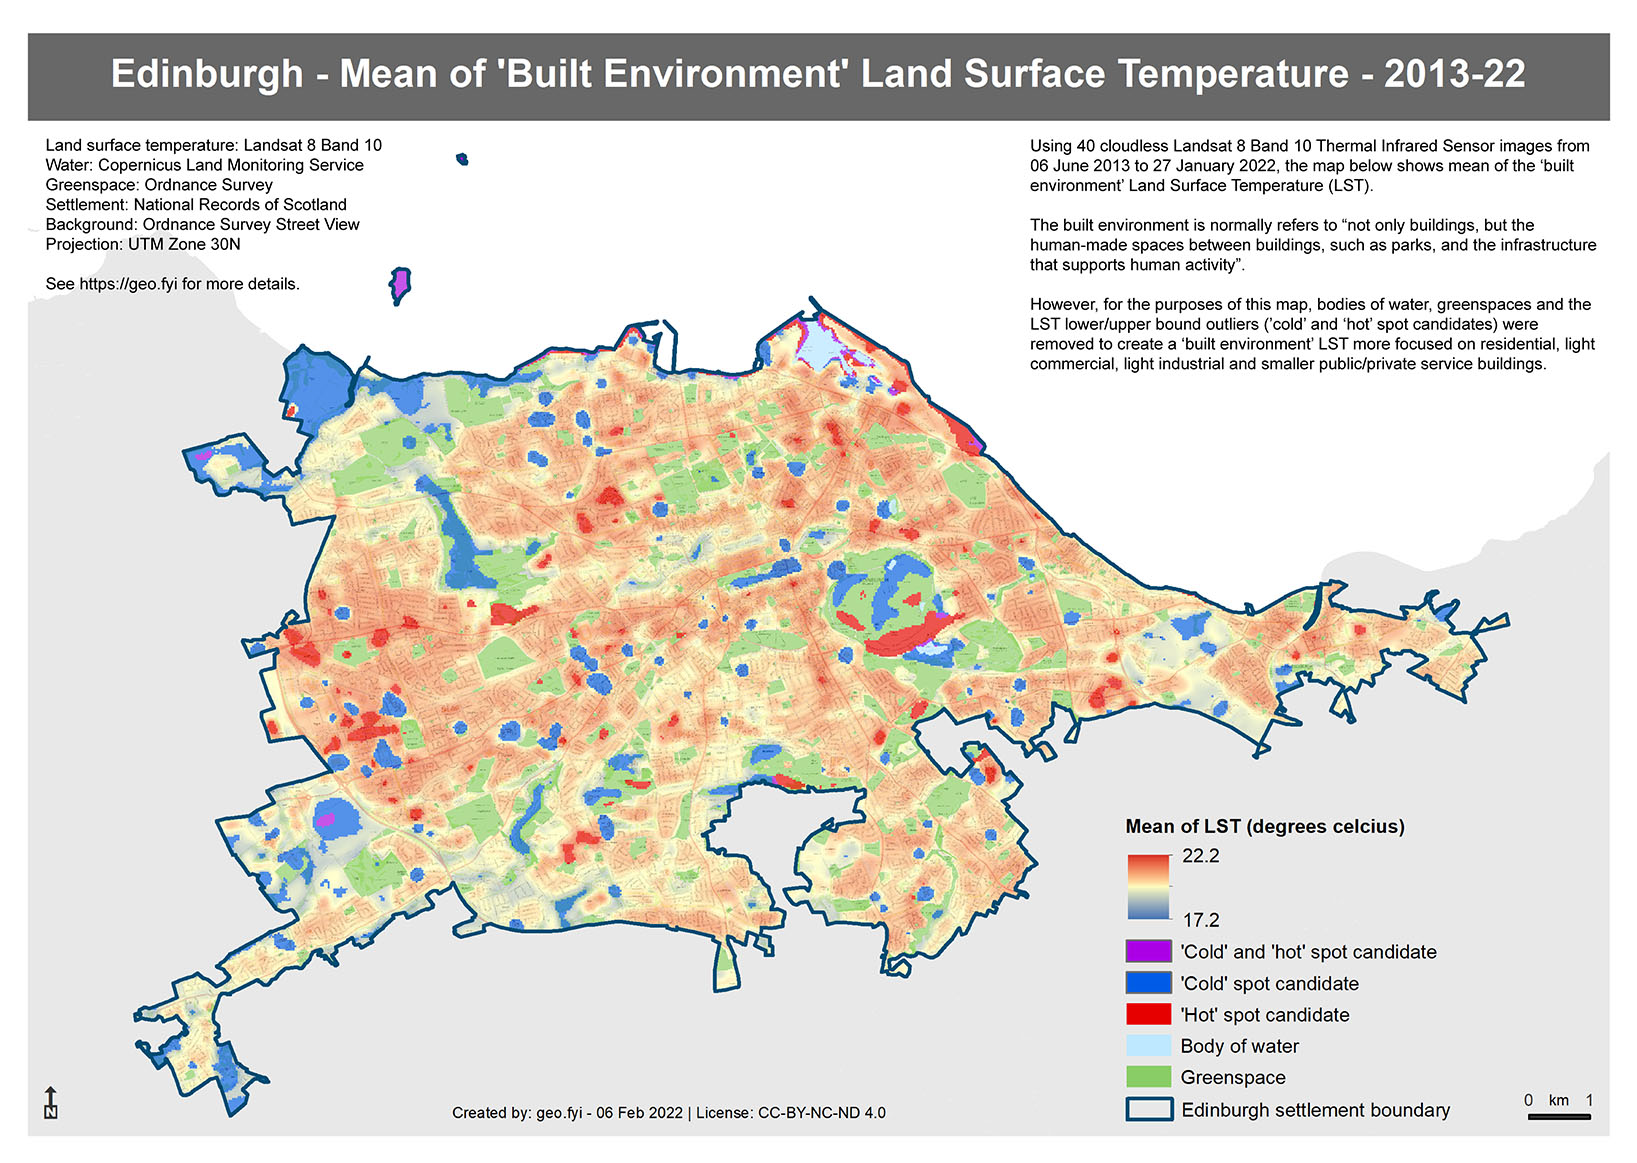
Built environment LST
The term built environment refers to:
“not only buildings, but the human-made spaces between buildings, such as parks, and the infrastructure that supports human activity”
However, for the purposes of this post the greenspaces and the outliers found above were removed from the data to create a built environment LST more focused on residential, light commercial, light industrial and smaller public/private service buildings.
Mean of ‘built environment’ LST
Mean of LST values at each pixel.
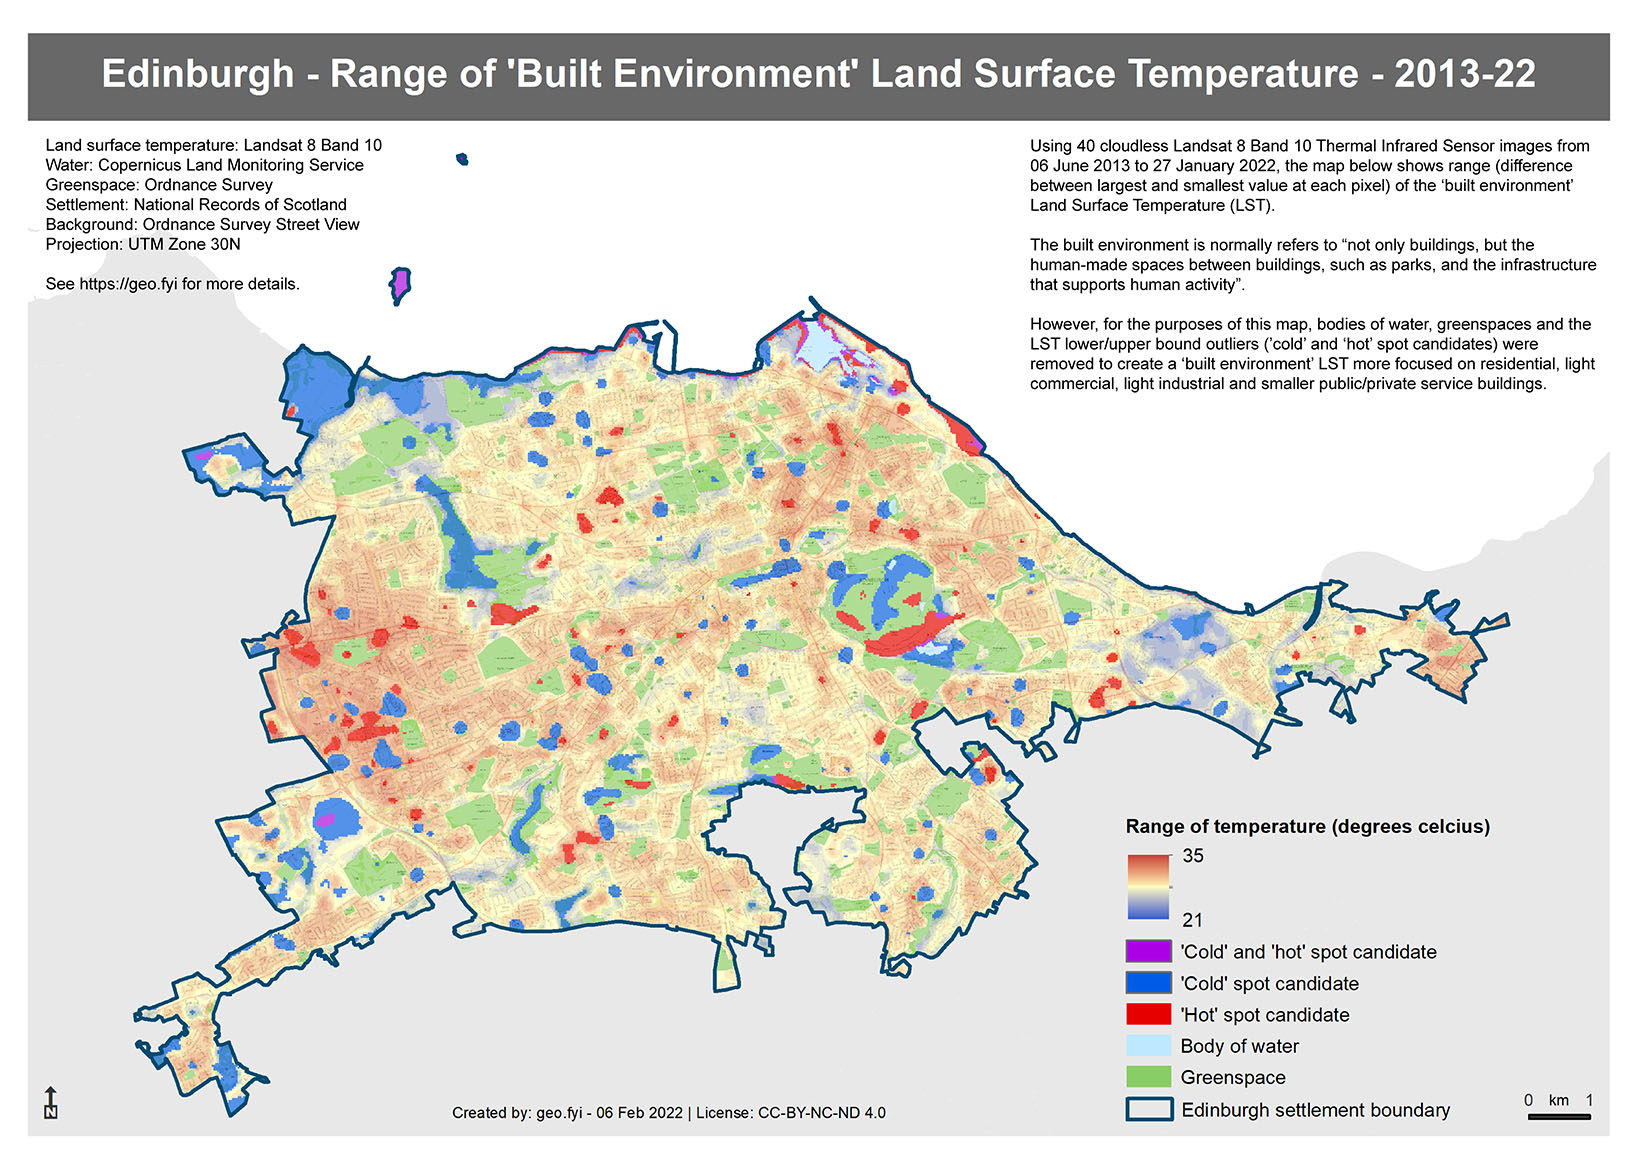
Range of ‘built environment’ LST
Difference between the largest and smallest LST values at each pixel.
Methodology
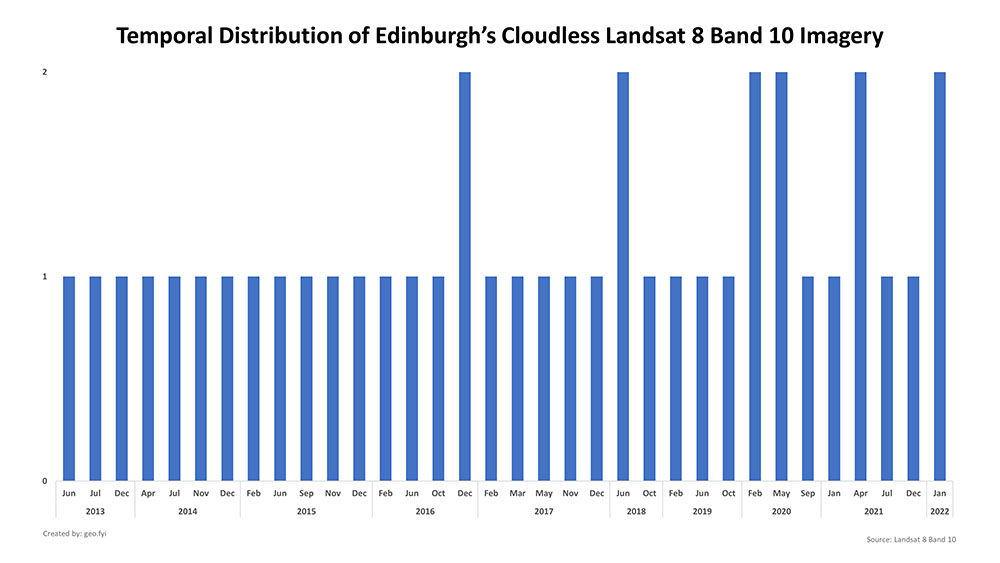
1. Landsat 8 image bundle selection
– 415 image bundles were discovered and downloaded for Landsat 8-9 OLI/TIRS C2 L1 covering Edinburgh from 21 March 2013 to 27 January 2022 (all taken at ~11:15)
– 375 image bundles were not used due to them being taken at night (16), not completely covering Edinburgh (1) or having cloud over Edinburgh (358).
– A sample of 40 image bundles were taken forward for processing.
2. Removal of bodies of water (Mask-1)
– To remove bodies of water within Edinburgh, a mask was created using Copernicus Land Monitoring Service Water and Wetness data.
3. LST calculations
– LST was calculated in degrees Celsius by extracting each Band 10 thermal image and its metadata, before applying a basic formula.
– The resultant LST images were then clipped to Edinburgh and Mask-1 applied.
4. Lower and upper bound outlier extraction
– The lower and upper bound temperature values for each LST temperature image were calculated using the formula:
mean of image pixel values +/- 2*standard deviation of image pixel values
– Another image was then created counting the number of times each image pixel value was an outlier i.e. above or below an individual LST temperature image calculated lower or upper bound.
– Any pixel only appearing 10% of the maximum occurrence time in these new images was then removed as it was deemed not to have been an outlier often enough across the months and years of imagery.
5. Removal of outliers and greenspace (Mask-2)
– To remove outliers and greenspace within Edinburgh, outlier data from stage 4 and Ordnance Survey Open Greenspace data was added to Mask-1 to create a second mask.
6. Built environment LST
– The LST images outputted from stage 3 above had Mask-2 applied.
– Cell statistics were used to calculate mean and range LST estimates.
